Why this campaign?
The Council's Local Plan is badly flawed

Richard Ingham
Population growth and its consequences for medical care, school places and transport, especially road traffic form a big part of the essential background to the Hall Farm development proposal included inthe Local Plan.
The map shows that over 90% of housing development in Wokingham Borough has been in the southern parishes, in brighter orange for those parishes where the most development has occurred. It was produced by a development consultancy a few years ago, showing 97% of new dwellings, in the ten years between 2010/11 and 2019/20, being built in Woodley, Earley or areas further south. In the last five years, the imbalance between our areas and the north of the borough has certainly increased, with the buildout of Strategic Development Locations in Shinfield, Arborfield and around Wokingham. This is clearly unfair by any standards, especially since Wokingham Council is known to have considered alternative sites, but has turned them down for reasons which we think are not good ones.
In the southern parishes, especially Shinfield and Arborfield, the Borough Council’s record on development has been materially damaging to people’s standard of living in key respects, which we deal with in turn below.
Population growth
Lots more houses means lots more people, and that’s what we've seen in Shinfield, Arborfield and Barkham civil parishes. Government census data from 2011 and 2021 says the population of these areas increased by over 40%.
To get a more up-to-date figure reflecting the last few years since the 2021 census, the register of electors can be used as a proxy for the actual population increase, for which official data are not yet available. The old Shinfield South, Barkham and Arborfield wards had getting on for 5,000 more adults on the electoral register in 2023 than in 2014.
Last year 2024 saw a change in the ward boundaries, but a comparable figure can be worked out by taking the new Shinfield, Barkham & Arborfield, and Spencers Wood & Swallowfield wards electoral register numbers, and then subtracting the Shinfield North and Swallowfield 2023 figures. That gives a total of roughly 17,000 registered electors, in the same areas as there were 15,000 in 2023.
The 2024 figure is only an estimated calculation, but there's no doubt that many thousands more people now live in these areas than 10 years ago, and require the usual infrastructure needs: an adequate transport network, adequate education facilities for their children, and not least adequate medical facilities. The problem is, these infrastructure needs have been grossly neglected by the planning authority.
Medical facilities
Let's look first at medical care. The borough can be divided into groups of medical practices by location, and the graph here shows how these groups of medical practices have been coping with the large increase in population.
The graph shows percentage rises in patient numbers per GP full-time equivalent, as published by the NHS. All areas have experienced sizable increases, except Wokingham Medical Centre, thanks to a big increase in the number of its GPs. The standout area is here in Shinfield, where in those eight years patient numbers per GP full-time equivalent at the medical centre just round the corner, and at the Swallowfield practice, rose by 60%.
Let's look at the actual percentage increase figures. The ‘Shinfield & Swallowfield’ percentage rise is particularly glaring, but the Swallowfield medical practice also serves Arborfield, including the houses on the old garrison site. It's no wonder that waiting times for a GP appointment have got so much longer across our area, with 61% more patients around here for GPs to attend to. The nationwide average number of patients per GP f/t equivalent is currently according to the BMA about 2,300. In Shinfield the figure is well over 3,000, the worst in the whole borough. 10 years ago, there were 2,200 patients per GP in the Shinfield area. That was not much above the then national average of around 2,000. Is it surprising that patient numbers have rocketed here, where we've also seen the highest population increase in the borough?
Secondary schools
Coming on to secondary school places, on the left is a graph showing the rise in names on the secondary schools waiting list 2016-2023, in the southern catchment area for Wokingham Borough. On the right is the rise in population over that time, as reflected in the register of electors:
The school waiting list goes up enormously over the same time-period of population increase, 2016-2023.
Evidently, the area has had more houses than the infrastructure can cope with. More houses than there are places for kids at school, more people than GP surgeries should be accommodating, and so on.
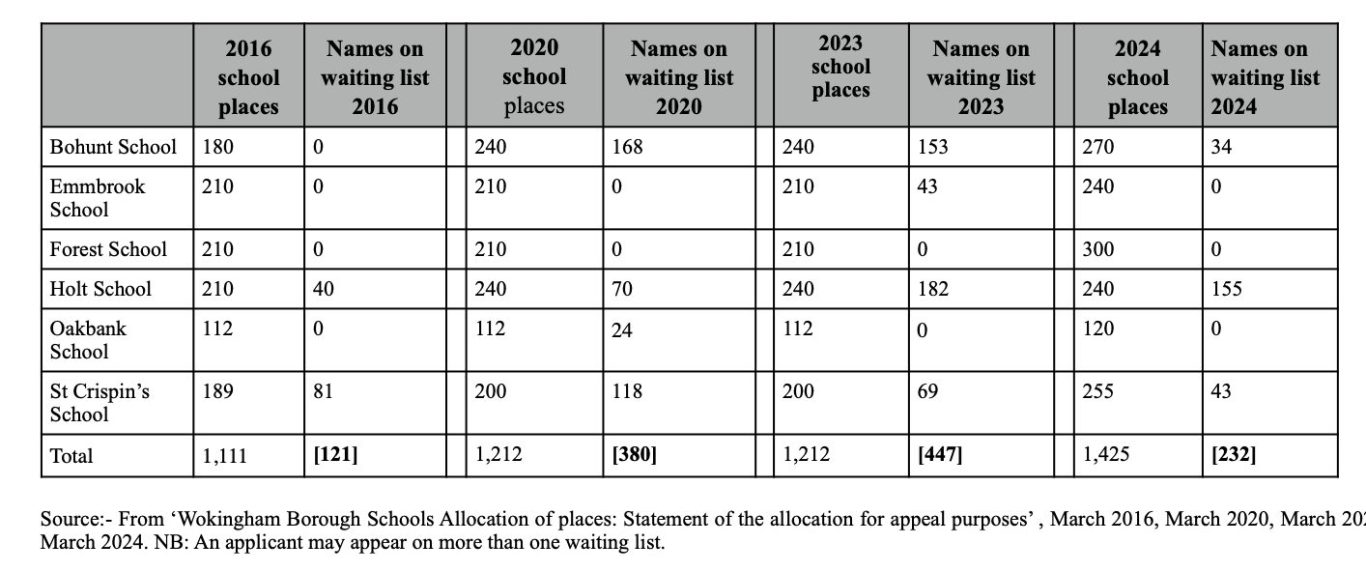
Let's brings the school places picture more up-to-date with the 2024 waiting list figures.
When we first look at those numbers, we might think: ‘For the first time in years the council has managed to get the waiting lists down’. And indeed it has. But look at how it's done that. Look at the increases in places that nearly every school has had to
provide since last yea, over 200 altogether. Add those to the actual 2024 waiting lists, and like for like the numbers haven't changed. What's happened is that more kids have been crammed into classrooms, so teachers have to teach to larger class sizes, or the school can hire more teachers, which may or may not happen.
So from these figures, it's clear that the council is barely keeping on top of an already dire situation with secondary school places. With the result that more and more parents are having to drive their children halfway across the borough a couple of times a day to get them to school.
Road transport
Let's look next at road transport in our area. And there is only road transport: no rail links as there would have been with Grazeley, and as there are with Winnersh or for that matter Twyford.
Traffic congestion in the area this in this area can be awful, but suppose you want to know just how bad things are getting. Suppose you ask the council for updated figures on traffic flows, for example, as did a Shinfield resident not so long ago, who got hopelessly outdated information. You might wonder why that was, until you look at places where around the Borough traffic flow information is supposed to be regularly collected.
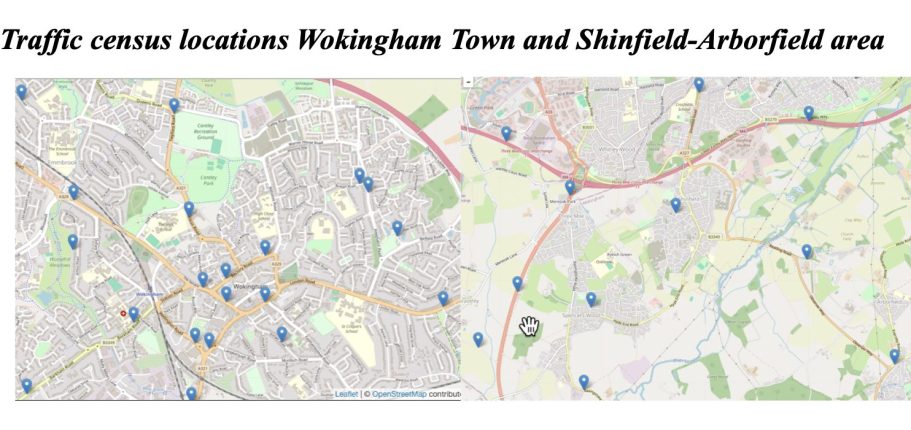
The blue blobs on the map below show on the left the traffic census locations in Wokingham town, and on the right the traffic census points around Spencers Wood, Shinfield, and Arborfield. Wokingham is well served, but there are not so many census points in the Shinfield-Arborfield area.
A couple of those points are in very sensible places, one at Three Mile cross approaching junction 11, one on the A 33, and one just leaving the A327 to go towards Barkham and Arborfield Green. But what about Shinfield? What about the Black Boy roundabout complex, known to be a major congestion blackspot? Nothing there. What about the A327 between Arborfield and Shinfield? There is one, but it's on the old A327 in Arborfield Cross (where the chicanes are)! Previously that would've been a good census location for through traffic, but not any more. In Shinfield, there is one blue traffic census location. But it's in Gloucester Avenue, a residential cul-de-sac well off the main road!
So council planning officers probably know that traffic congestion around Shinfield is dire, but they don’t appear to have a reliable way of getting the information they need to assess it properly, thanks to where they've located their census points. This is one more example of the hopelessly dysfunctional performance of the Borough Council when it comes to planning and everything associated with it.
Too much traffic, too many houses; not enough school places, not enough GP provision. And all courtesy of WBC's planning decisions over recent years. It's time the local planning officers were held to account for the dire consequences of their ill-thought-through policies. And it's time future planning stops repeating past mistakes and considers the well-being of all parts of the Borough, not just those where party politicians hope to gain votes.


©Copyright. All rights reserved.
We need your consent to load the translations
We use a third-party service to translate the website content that may collect data about your activity. Please review the details in the privacy policy and accept the service to view the translations.